Hello, I'm Allen.
I'm delighted to be partnering with Kids in Data and looking forward to getting kids excited about data! Data is everywhere we look and the sooner everyone gets familiar and comfortable with it the better! I am passionate about data literacy. Data literacy is the ability to read, understand, create and communicate data as information. I enjoy telling stories with data. Every story teller loves an engaged audience, and who can ask for a better audience than kids when it comes to sharing your stories with?
It's estimated that 90% of the world's data has been created in the last few years. It's safe to say that's a lot of data. Kids in Data has come up with a way to start getting kids engaged with the data around them in the most fun way - Games! Let's walk through how playing Space Invaders can get kids thinking their way through data by asking:
- What do I want to find out?
- What data do I have to work with?
- How is the data grouped?
- What kind of patterns do I see?
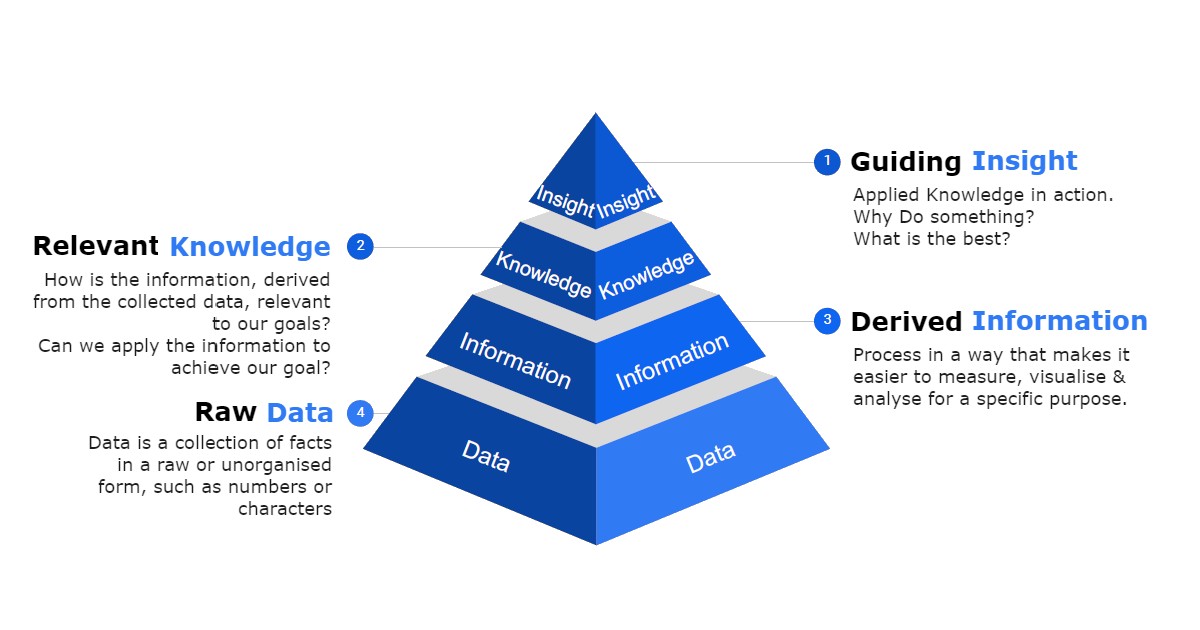
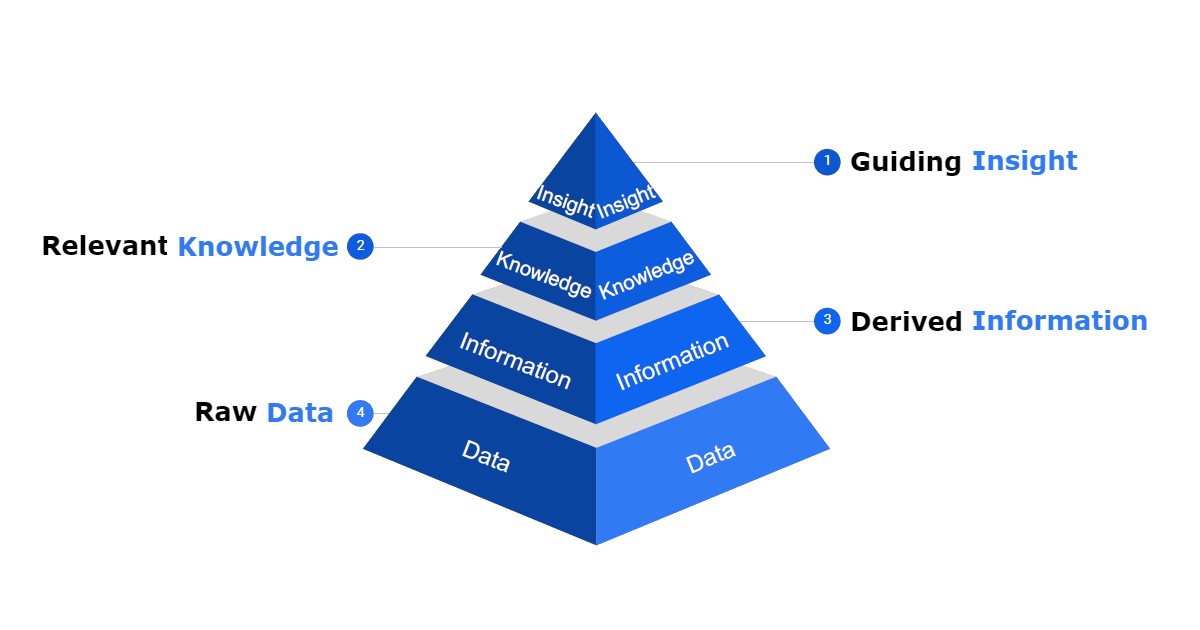
To tackle these questions, we can guide the children to follow a four tier pyramid system. We start with the raw data, use that data and turn it into meaningful information which we can use to gain knowledge on the subject matter. And at the top of this pyramid what sits is our insights, which we can gain from the knowledge gathered through this process.
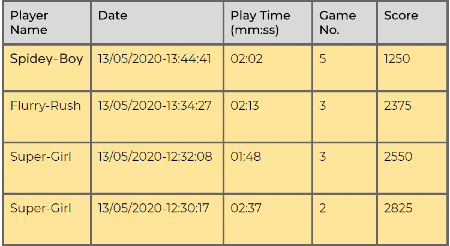
Tier 4 - Raw data
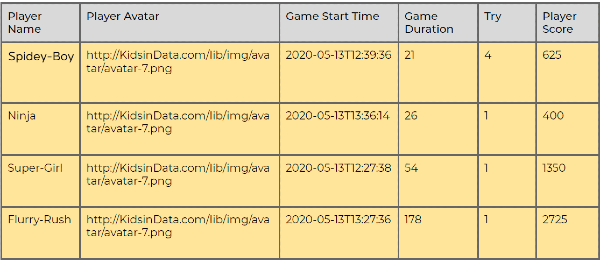
Lets start from the bottom of the pyramid, the raw data. The below table shows the raw data as the KiD platform captures it. Its a lot of information but not really organised well. Column labels, date format is not presented in an user friendly manner. It contains lots of noise (E.g., the players' avatar location etc) which may not be relevant for the questions children are trying to answer with this data.
Tier 3 - Information
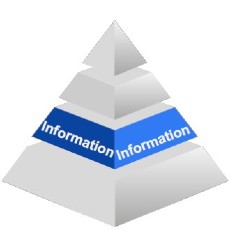
Lets move up to the
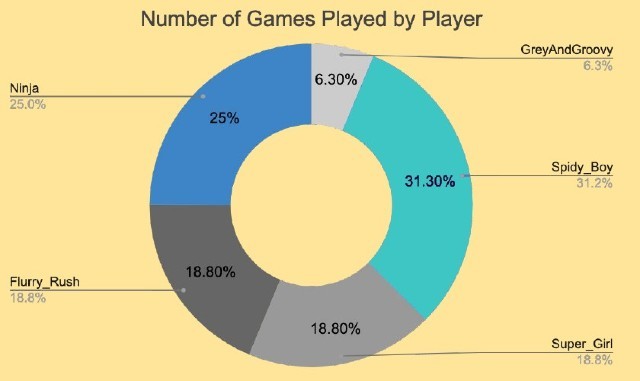
Tier 2 - Knowledge

We now move to our knowledge tier of the data literacy pyramid. On this tier, we leverage the information gained in the previous tier. From that we gain some further knowledge on how each player performed and how the workshop progressed.
E.g., the chart below tells us player Ninja and Spidey-Boy played the most games in this workshop. We are able to gain this knowledge by preparing our raw data into meaningful information, which then helped us to formulate this analysis and create the chart.
Tier 1 - Insights
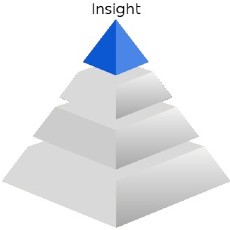
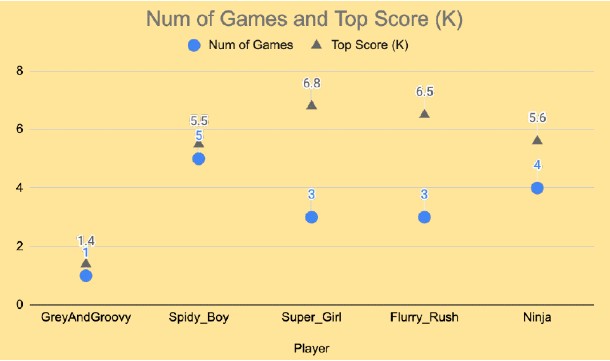
We now move to our top and the last tier of the data literacy pyramid. On this tier, we use the knowledge gained through the process to look for insights and correlations, try to increase our understanding of what the data is telling us. More insights can be gained from the KiD workshop data that we have been using so far to see how everyone in the workshop performed in the Space Invaders games.
The below scatter plot shows the number of games each players in the workshop played against their top score. The plot shows that there is some correlation with playing the game more and obtaining a higher score. This is good news! This shows engagement as the students play more games to obtain higher scores. After the game play, we follow this up with reviewing the scores and other data points with the children to show how we can begin to tell stories around their activity. This encourages them to explore the data further, ask questions, answer them using the data and find trends doing so.
Sharpen decision making skills with improved data literacy
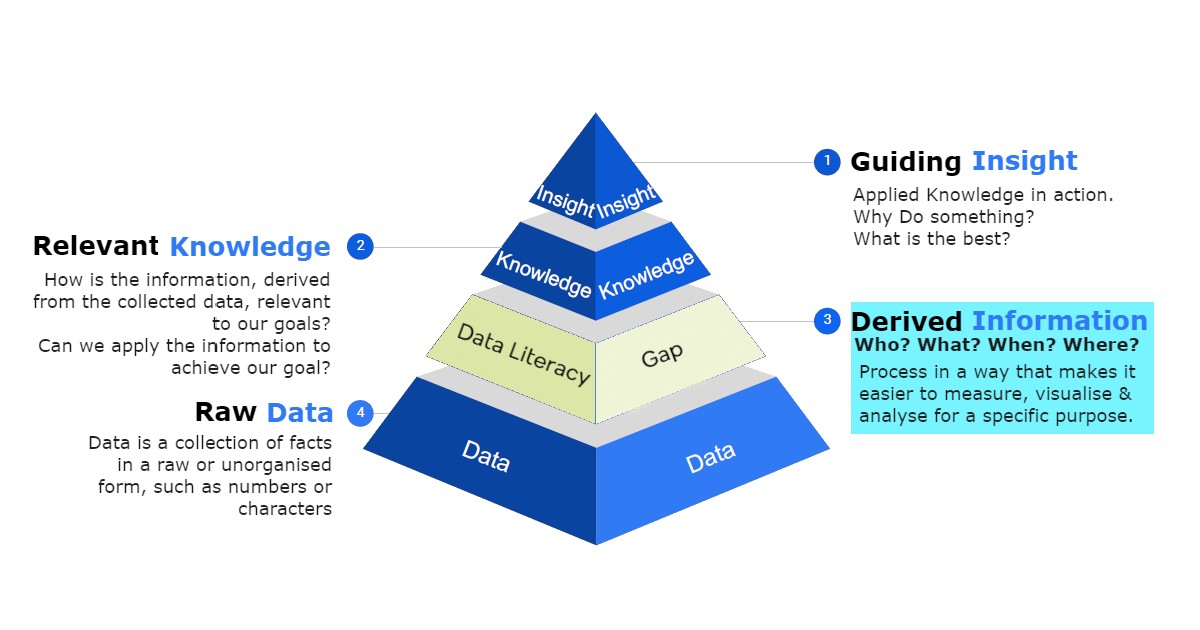
Following this data literacy pyramid process helps us understand our data better, thus allowing us to ask the correct questions and answer them using the data. Some parts require more focus then others and I believe the transformation of the raw data (tier 3) plays a vital role on how we shape rest of the process. The gap lies in gathering useful information from the data that can help us make more informed decisions. This is one part where we need to be able to think and ask the correct questions in order to gather the correct information from our data. Improving our data literacy skills, asking the correct questions and removing the noise from our data is the key to sharpening our decision making skills.